
District Revenue and Expense FAQs
Where does San Juan’s revenue come from and how is it spent?The San Juan Water District receives revenues from several sources, but the largest source is usually from rate revenues. In the rare instance that the District needs to issue debt, that can become the largest revenue source for that year, as illustrated in this pie chart:

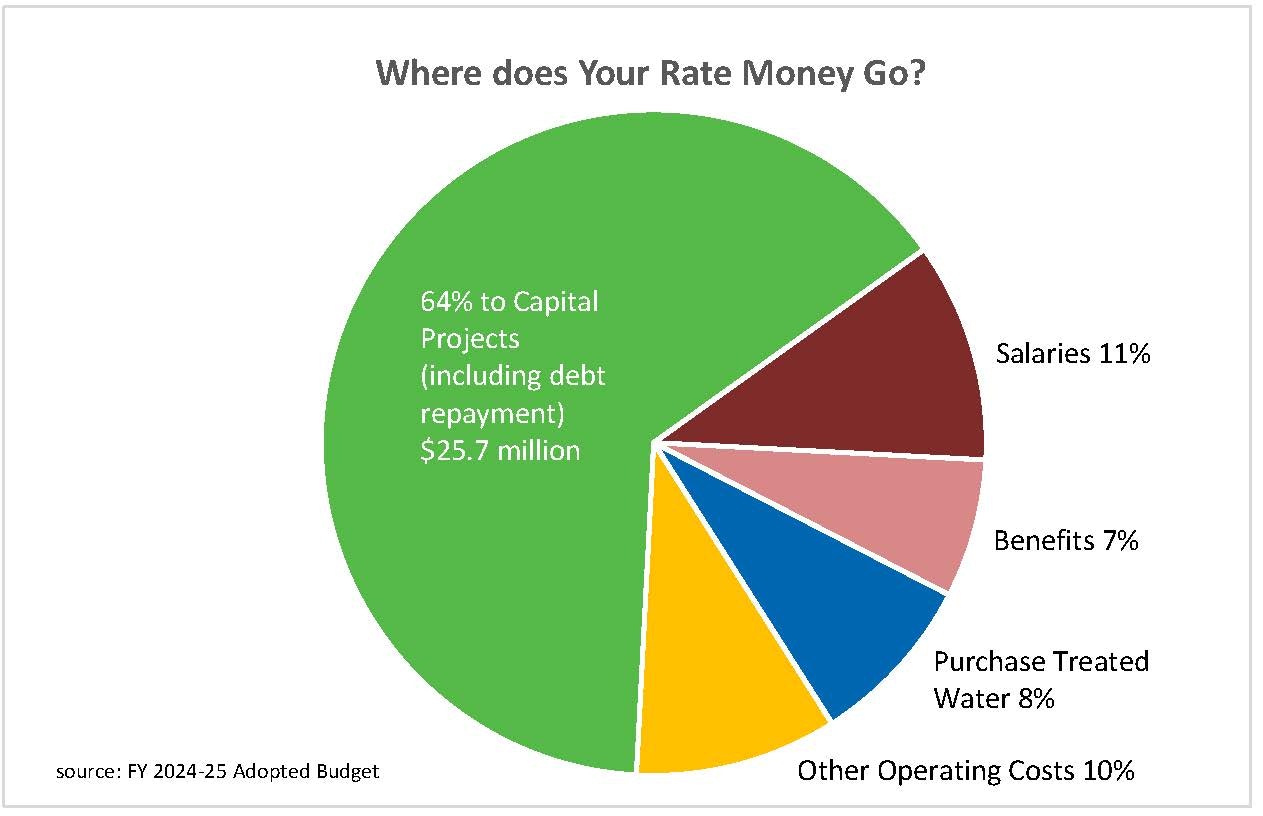
For fiscal year 2024-25, 46% of revenues are expected to come from your rate revenue. It is usually around 80-90% but this year the District anticipates issuing $17.1 million in debt to pay for the replacement of the Kokila Reservoir, a critical piece of clean drinking water storage and for groundwater pumping capacity for supply redundancy. While debt issuance and property taxes are restricted to funding the capital program, your rate revenues are the primary source of funding the operations of the system, including maintenance of the approximate 288 miles of pipeline that bring the water to your tap. The pie chart below shows "Where Your Rate Money Goes":
How have San Juan’s retail operating revenues and expenses changed in recent years - what has the District done to control costs?
Between fiscal years 2013-14 and 2016-17, the retail operations of the District generated cumulative losses of approximately $4 million, despite rate increases over that same period. Rate increases were being applied to both the daily base rate and the volumetric rate. When consumption fell in response to the drought, revenues fell as well. Starting in 2017 rate increases were applied only to the fixed daily base rate, not the volumetric portion. It isn’t fair to the rate payers to be asked to conserve water, then be faced with a rate increase because revenues fell. This practice continued through 2022 at which pointThe rate plan included increases to the daily base rate through January 2021 and, as shown in the graph above, has resulted in increased revenues sufficient to generate surpluses, which the District sets aside in reserve for future capital projects. Building up healthy reserves will allow the District to pay for it’s capital program with cash, in the long run, thus avoiding expensive debt that has to be repaid with your rate dollars.
The San Juan Water District understands that almost everything it does is paid for with your hard earned dollars and not all financial woes can be solved by raising water rates. The District has taken many actions to control costs including:
- Salary Schedule reduction: The District historically maintained a compensation package that was 10% above market average. In FY 2019-20 the Board of Directors reduced this target down to market median. This held salaries constant for many employees, for several years. After experiencing increased turnover and difficulties hiring talented people, the board increased the market target to 5% above market median in 2022.
- Controlling pension costs by transferring the responsibility to employees to fund 100 percent of the employee’s share of pension contributions.
- Created a second tier of reduced pension benefits.
- Paid down the Unfunded Pension Liability: The District was paying 7.5% interest on this liability, but was only earning approximately 1.5% on its reserves. Between May of 2017 and April 2018 the District remitted just under $7 million to CalPERS, achieving a 95% funded ratio, saving rate payers approximately $8.8 million through FY 2036-37, with annual savings of approximately $350,000.
- Created a second tier of reduced benefits for retiree health benefits.
- Held staffing relatively constant.
- Refinanced existing debt: In May 2017 the District refinanced one of its debt issuances, saving the ratepayers approximately $11.2 million through FY 2038-39. In 2022 another debt was refinanced, saving ratepayers approximately $1.75 million.
- Utilization of California State Water Resources Control Board’s Revolving Loan Fund Program (SRF): The SRF grants low-interest rate loans for drinking water capital improvement projects. The interest rates on these loans are typically half of what the District would pay through a traditional bond issue. For example, the District secured an SRF loan for the Hinkle Reservoir Replacement project at 1.2% interest. If the District were to have financed this project through a traditional bond issuance, the interest rate would have been closer to 4%, increasing debt service costs by at least $12 million over 30 years. The District intends to utilize this program for the Kokila Reservoir Replacement Project, budgeted for FY 2024-25.
- Renegotiated water contract with Placer County Water Agency: The District negotiated an amendment to its contract with PCWA wherein the take or pay amount was reduced from 25,000 acre-feet to 12,500 acre-feet. The District still has the option to take up to 25,000 acre-feet, but is only required to pay for 12,500 acre-feet regardless of whether it takes the water or not. This cut the PCWA water supply costs in half, providing savings of approximately $275,000 per year, starting in FY 2018-19.
- Renegotiated contracts with City of Roseville (City): Under two separate contracts, the District is obligated to provide up to 4,000 acre-feet annually to the City from the District’s PCWA take or pay contract. The amendments require the City to compensate the District for maintaining the availability of 4,000 acre-feet per year water supply for the City. This generated annual revenues of approximately $90,000 beginning in FY 2018-19, however, the city of Roseville cancelled its contracts with the District in FY 22-23.
- Completion of a fee study and subsequent adjustment of fees to achieve full cost recovery. In addition to water rates, the District charges fees for various customer, or developer specific actions, such as hydrant meter rentals, development inspections, etc. These activities do not benefit the ratepayers as a whole. As such, the full cost of these activities should be borne by the individuals or businesses who are benefiting. The Board approved a new fee schedule that sets these fees at full cost recovery levels. This will put downward pressure on your future water rates.
- Treating surface water for others: The Sacramento Suburban Water District frequently purchases surface water from the Placer County Water Agency, but they lack a water treatment plant facility. They pay the San Juan Water District to treat their water, generating millions of dollars in revenues that are used to offset operating expenses and thus result in lower rates.
These efforts, combined with a constant mindfulness to operate efficiently and frugally has changed the trajectory of expenses and revenues over time, as illustrated in the graph below:

From FY 2014-15 through FY 2016-17 the retail service area’s expenses were greater than revenues. After implementing all the above actions, not only are revenues greater than expenses, but the District is strategically saving money for future planned infrastructure replacement projects, to minimize the need to issue costly debt in the future. Recent increases in operating expenses stem from an increase in the maintenance of the distribution system. The rate increases have provided staff the resources to fully complete all system maintenance tasks for the first time in well over ten years.
What are SJWD retail reserve levels and are they adequate?
Retail reserves were approximately $13 million as of June 30, 2015, and were drawn down between then and FY 2018-19 to pay for needed capital improvement projects. Reserves have been steadily increasing since then, in anticipation of future capital improvement needs. The District’s Retail Master Plan identified a variety of capital projects that need to be completed through FY 2034-35, all but three of which the District intends to pay for with cash, i.e., saved reserves. The cost of the projects identified from FY 2025-26 through FY 2034-35 is $68.5 million (adjusted for inflation). The District anticipates having reserves of $15 million at the end of FY 2024-25 to go towards these projects. The District is confident that by adhering to its Financial Plan, it can build sufficient reserves to fund these critical projects. For a listing of the projects, please see the Capital Improvement Plan in the Retail Master Plan, found here: Retail Master Plan